Introduction:
Total body plethysmographic measurements have been a mainstay in some hospital-based Pulmonary Diagnostic Laboratories for many years. Since individuals with obstructive lung disease have similar appearances of their forced expiratory spirograms, airway mechanics measurements are employed to assist the clinician to differentiate the site, as well as quantify the severity, of airflow limitation. On the other hand, some individuals with airways disease may have essentially normal appearing spirograms. In this instance, measurements of airway mechanics enhance pulmonary diagnostic evaluation and provide the clinician with better information about the integrity of the patient’s airway caliber. Because of this heightened sensitivity, airway mechanics may be incorporated as primary diagnostic measurements, as well as adjunctive measurements, to evaluate the presence and/or extent of airways disease.
Nevertheless, in the past, because of perceived technical and procedural difficulties associated with measurements of airway mechanics (specifically total airways resistance [Raw], its reciprocal conductance [Gaw] and lung volume adjusted values such as specific resistance [sRaw] and specific conductance [sGaw]), most testing was generally limited to research and/or larger hospital-based laboratory environments.
Within the last 30 (plus) years, design improvements combined with computerization of data collection have resulted in today’s total body plethysmography systems becoming more reliable, easier to operate and easier to maintain. However, it should be appreciated that even the most sophisticated and accurate equipment is useless unless there exists a well informed and highly trained user to obtain and report reliable patient data so that physicians may develop the best possible medical treatment plans for his/her patients.
The American Thoracic Society (ATS) has published a number of recommendations designed to help standardize pulmonary diagnostic practice. In 1998, the ATS first published the Pulmonary Function Laboratory Management and Procedure Manual with the intent of providing rationale behind, as well as standardizing, the methods involved with how pulmonary diagnostic testing data is derived and reported. Airway resistance measurements were addressed in this nationally accepted resource. The ATS manual is periodically updated to reflect current practice.
Additionally, the American Association for Respiratory Care (AARC) recognized practice variability and the necessity to standardize body plethysmographic measurements. Therefore, in the December 1994 issue of Respiratory Care, the “Body Plethysmography” Clinical Practice Guideline (CPG) was first published in an effort to potentially reduce practice variability. AARC CPGs have a common design which address issues related to procedural descriptions, indications, limitations, contraindications, hazards/complications, limitations of methodology/validation of results, assessment of test quality, resources (including personnel), as well as monitoring and infection control issues. This Body Plethysmography CPG was subsequently updated in 2001.
Note: The AARC Body Plethysmography CPG has been retired (as have the majority of AARC Cardiopulmonary Diagnostic CPGs) with deference given to the ATS Pulmonary Function Laboratory Management and Procedure Manual and the specific published ATS/ERS Pulmonary Diagnostic procedure recommendations . However, in my opinion, both the ATS and AARC references are required reading for any practitioner performing total body plethysmographic measurements. For the AARC CPGs, please see Clinical Practice Guidelines ; or copy and paste to your browser: https://www.aarc.org/resources/clinical-resources/clinical-practice-guidelines/ .
The intent of this article is to serve as an introduction to the practical methods of recognizing the indications, limitations as well as examples of how airway mechanics measurements can enhance pulmonary evaluation of select patients. Improvements in disease detection should ultimately reduce healthcare costs as patients would be medically managed more effectively and efficiently.
What is a Plethysmograph, How are Measurements Performed and What Do They Mean?
A plethysmograph is simply an instrument used to determine the size of an object. A whole body plethysmograph totally encloses the body and can be used to calculate the volume of gas in the thorax (VTG), airway resistance (Raw), and related indices.
During the airway mechanics testing process (employing a constant volume and variable pressure plethysmograph; the type that is commonly incorporated in the clinical setting, in the United States), once closeted the subject breathes through a flow measuring device (e.g., pneumotach) while wearing nose-clips and using their fingers to support his/her cheeks.
- The subject is then instructed to gently, yet rapidly, begin to “pant”; generally in the range of 1.5 to 2.5 Hz (where 1 Hz = 1 cycle per second) while moving between 50 and 100 mL of air per pant (see Graphic 1. “Open-Shutter” maneuver).
- Once an acceptable number of open-shutter pants have been collected, a mouth shutter is closed and the subject continues to gently pant against the closed-shutter (see Graphic 2., “Closed-Shutter” maneuver) at approximately 1.0 Hz.
- After a few closed-shutter pants are collected, the shutter is opened and the subject returns to tidal (“normal”) breathing between measurements.
- Note: If static lung volumes are also to be assessed, the ATS recommends performing “linked’ maneuvers at this time. That is, after the closed-shutter panting is performed, and the shutter opens, have the subject immediately perform a relaxed (Slow) vital capacity and then return to tidal breathing before performing the next round of open-shutter panting maneuvers.
- However, some individuals may “pant” at a volume either slightly above, or below FRC. More reliable measures, of static lung volumes, may be obtained if a relaxed/slow Vital Capacity (VC) is performed right after measuring FRC VTG (vs Vpant) since the VTG may more accurately reflect the actual FRC than does Vpant.
- Additionally, deep inhalations cause a transient bronchodilation in healthy and mild asthmatic airways, and may cause bronchoconstriction in severe asthmatics. Therefore, unless specifically indicated, deep inhalations should be avoided during airways mechanics measurements as they obviously alter resting airways mechanics data.
- Note: If static lung volumes are also to be assessed, the ATS recommends performing “linked’ maneuvers at this time. That is, after the closed-shutter panting is performed, and the shutter opens, have the subject immediately perform a relaxed (Slow) vital capacity and then return to tidal breathing before performing the next round of open-shutter panting maneuvers.
- The test session is terminated once an adequate number of technically acceptable maneuvers (generally 3 to 5 separate efforts) have been obtained.
It is during the “open-shutter” panting mode when airway resistance measurements are made; by plotting changes in pressure (mouth pressure – alveolar pressure) divided by flow and calculating the resultant tangent (measurements are commonly made between + & – 0.5 L/s; small dashed line on the left of the “open-shutter” loop). The total body plethysmograph resistance measurement is then corrected for the lung volume at which resistance was measured by measuring the closed-shutter tangent; as the changes in mouth pressure are plotted against changes in volume (box pressure). See Graphic 3.
Graphic 1.
Graphic 2.
Graphic 3.
Since airway resistance is a function of lung volume, measuring the absolute lung volume at which the resistance procedure was performed enables the practitioner to adjust airway resistance to this lung volume and evaluate the site of airflow limitation. For example, some individuals with peripheral airways disease, during testing, will increase their lung volume to decrease airway resistance (it’s easier for them to tolerate; less work). However, by doing so, the lung volume at which the Raw is measured is increased resulting in an increased sRaw (a decreased sGaw).
Conversely, if the site of obstruction resides in the central airways, these individuals will not be able to substantially reduce their Raw, by increasing their lung volume, since the central airways are less compliant per unit volume of change (than are the peripheral airways). Therefore. Raw will remain increased.
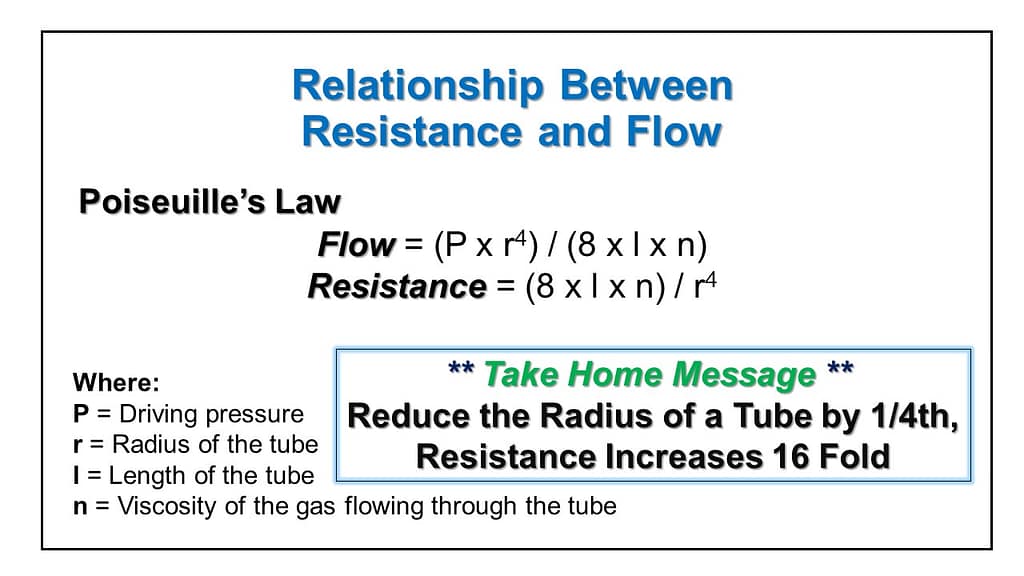
What can be readily appreciated is that very small changes in airway caliber will have profound effects on Airway Resistance
The entire process, from test instructions and demonstration to final measurements, commonly takes place in less than 5 minutes. Thus, airway mechanics measurements are rapid, easy for subjects to perform and require a minimum of subject participation in the testing process.
Terminology and Concepts
- THORACIC GAS VOLUME (VTG): The volume of air in the thorax at any point in time and at any level of thoracic compression. It is measured during the “closed- shutter” maneuver. It may be determined at any level of lung inflation; however it is most commonly determined at FRC.
- AIRWAY RESISTANCE (Raw) : Resistance to airflow is determined by dividing the pressure difference between mouth pressure (Pm) and alveolar pressure (PA) by airflow (V). Airway Resistance is measured during the “open-shutter” panting maneuver.
Raw = (Pm-PA) / Airflow
Normal Adult Value = < 2.00 cm H2O/L/s
Note: There is a hyperbolic relationship between Lung Volume and Raw: As Lung Volume Increases, RawDecreases
- AIRWAY CONDUCTANCE (Gaw): The reciprocal of resistance.
Gaw = 1 / Raw
Normal Adult Value = > 0.50 L/s/cm H2O
Note: There is a direct (~ linear) relationship between Lung Volumes and Gaw: As Lung Volume Increases, GawIncreases
- SPECIFIC AIRWAY RESISTANCE (sRaw): The lung volume at which airway resistance is measured.
sRaw = Raw x Volume
Normal Adult Value = < 5.0 cm H2O/L/s/L
- SPECIFIC AIRWAY CONDUCTANCE ( sGaw ): The lung volume at which Gaw was measured.
sGaw = 1 / sRaw
Normal Adult Value = > 0.21 L/s/cm H2O/L
NOTE: “Normal” adult airway mechanics reference values are from the Ward and Beauchamp study.
PROCEDURE:
The subject is allowed to choose the lung volume at which they feel most comfortable to perform the open-shutter maneuver. The measurement adjusts for the lung volume at which it was performed
- The volume chosen by the patient is generally close to FRC (but may be slightly above or below FRC).
- NOTE: Some individuals with “COPD” may perform the panting maneuver somewhat higher than FRC in an effort to reduce a perceived increase in airflow resistance and increased work-of-breathing versus performing the maneuver at FRC. See Figure below.
This Figure illustrates the relationship between Lung Volume, Airway Resistance (Raw), Airway Conductance (Gaw) and Specific Airway Conductance (sGaw).
Essentially, as Lung Volume INCREASES, Airway Resistance DECREASES and Airway Conductance INCREASES.
* Note that Specific Airway Conductance remains basically unchanged no matter what lung volume is chosen.
Indications and Applications:
Some common Indications and Applications for airway mechanics include the need to:
1. differentiate types of obstructive patterns having similar spirometric configurations
2. evaluate resistance to airflow
a. differentiate sites of airway obstruction
b. central versus peripheral airway components
3. assess response to therapeutic intervention
a. bronchodilator (acute or chronic)
b. steroids, Leukotriene Modifiers
4. assess the magnitude of response to a bronchoprovocative agent
5. follow the course of disease
Unlike forced expiratory spirometry, minimal patient participation is required during airway mechanics. Airway mechanics measurements provide information about the structural integrity of the airways that is not evident with forced expiratory spirometry. Admittedly, both tests examine flow properties of the lung.
Airway mechanics are generally more sensitive to alterations in flow earlier than can be seen with forced expirations. For example, a subject’s PEF (Peak Expiratory Flow) may still be maintained within the normal range even if the functional diameter of the airways is decreased by 50%, as long as he/she still has adequate lung volume, respiratory muscle strength, pulmonary elastic recoil and effort when performing the PEF measurement.
This decrease in airway caliber, while not always evident with forced expiratory spirometry, will be detected and evidenced as an increased resistance of the airways (Raw).
Additionally, there is evidence which suggests that the peripheral airways contribute much more than 20% of total Raw,; possibly the majority of airway resistance. Therefore, Raw measurements (sGaw in particular) may detect early (mild) peripheral airways disease.
Case Study Example
Discussion: This subject was referred for baseline testing as he perceived breathing difficulty, especially while at work. He has been working as a baker for the last 6 months and symptoms appeared soon after his employment and stated that while available he chooses not to wear a respirator. His past medical history was negative and there is no family history of asthma. Until recently he was a long-distance runner, but decided to reduce this activity as his exercise tolerance was worsening.
When compared to his reference values (for someone of his age, gender and height) the baseline spirometry values show “super-normal” FVC, FEV1 and PEF, which may be related to his exercise/training history. While still within the normal range, the % predicted FEF25-75% may be considered disproportionately lower than the % predicted FVC. However, the 1991 ATS Interpretation recommendations state that well trained athletes may have a reduced FEV1/FVC ratio as well as reduced mid-flows primarily because of the training effects on thoracic musculature.
Airway mechanics measurements fall within the broad range of normal, although the sGaw is on the low end of the normal adult range. Again, when compared to his increased spirometry values, this sGaw may too be disproportionately reduced.
An acute response to bronchodilator (Albuterol) was elected to be performed, during this visit, to see if his mid-flows and sGaw might improve. As can be seen, there was no significant bronchodilator response in his spirometry values, however sGaw dramatically improved (i.e., > 45% change post-intervention compared to baseline). This again illustrates the limitation of simply using spirometry to assess the potential effects of beta-agonist response in the clinical setting.
Further testing, on another day, our case study subject exhibited a positive spirometric and airway mechanics responses to a low dose (1 inhalation of 5 mg/mL) of methacholine confirming the suspicion of reactive airways disease
Additional Case Studies
The following case studies should assist the reader with a better understanding of the usefulness of incorporating airway mechanics measurements into his/her practice.
* Please note that, for all examples, %Predicted (%Pred) is used for illustration purposes only and should not be considered the sole method to assess pulmonary dysfunction. Also, all Methacholine challenge case studies were performed prior to recent ERS bronchial challenge method recommendations (see Recommended Readings below).
Number 1
Discussion: This subject was referred to the laboratory to assess reversibility of documented airflow limitation; based upon screening spirometry. She presented with spirometric evidence of airflow limitation as evidenced by a reduction in her FEV1/FVC ratio, combined with a reduction in FEF25-75%. Note however that her PEF fell within the normal range and unlike the FVC, FEV1, and the FEF25-75% did not exhibit a positive response to acute inhalation of a bronchodilator (Isoproterenol)
- The ATS has defined a positive response to a beta-agonist as a >12% (and >0.2L) improvement in either the FEV1 or FVC. We might also consider a positive beta-agonist flow response as an improvement of at least 25% in either the PEF and/or the FEF25-75%. Despite significant post-drug improvements in FVC and FEV1, as well as FEF25-75%, the subject’s spirometry values did not “normalize”. Note however that post-Isoproterenol airway mechanics measurements improved significantly; Raw normalized and sGaw approached a near normal value.
The question then arises, why did this subject’s airway mechanics measurements more closely approach the normal range and her spirometric values (while admittedly are significantly improved) did not? During measurements of airway mechanics (Raw), the maximal compressible effects occurring during forced expiratory maneuvers are obviated. Some beta-agonists, Isoproterenol in particular, cause transient decreases in bronchial myogenic tone, which results in airways becoming more compliant and “compressible”; airways temporarily lose the structural rigidity exhibited during bronchospasm as the bronchial smooth muscle relaxes. Therefore, in this example, while the forced expiratory volumes and flows improved, they did not “normalize” as was seen with her measurements of airways mechanics. Remember, airway mechanics require minimal movement of air, and intrathoracic pressure, during the measurement process.
Number 2
Discussion: This subject was unable to perform FVC maneuvers in an acceptable and reproducible fashion; her efforts were generally submaximal as well as being variable and discontinuous. Since airway mechanics measurements require minimal patient effort, these tests were chosen to assess the presence of airflow limitation in this subject.
Baseline values indicate an elevated Raw and profoundly decreased sGaw. Post-isoproterenol values demonstrate near normalization of Raw with a significant improvement in sGaw. The improvement in sGaw indicates the improvement in Raw was not due entirely to in increase in lung volumes during the measurement process.
This trend towards an acute improvement in post-drug airway mechanics substantiates the need for appropriate pharmacologic intervention and management with this subject in-order-to optimize her pulmonary function. A subsequent follow-up, after a two week trial of beta-agonist and inhaled steroids, showed further improvement in airway mechanics (sGaw = 0.19) which confirms the efficacy of her medical/pharmacologic management. This case underscores the utility of this test to evaluate patients having limited ability to perform spirometry, or who may be malingering.
Number 3
Discussion: This subject was evaluated for the possibility of having reactive airways disease, as he noted occasional “wheezing”, particularly after exercise. An “Exercise-Induced Bronchospasm Study” was negative. However after he was administered a total of 150 cumulative units (cu) of Methacholine he exhibited a positive response, particularly in plethysmographic measurements (Volume of Thoracic Gas [VTG]] and sGaw). These changes are indicative of non-specific airway hyperreactivity. Plethysmography measurements proved to be much more sensitive (than spirometry) when evaluating this subjects response to an inhalation challenge. Simply measuring his spirometric response would not have been effective enough to quantify the extent of bronchoconstriction that occurred during this test; the FEV1 did not decline by at least 20% (the indicator most clinicians use to evaluate airway hyperreactivity).
- Note: despite the significant elevation in VTG and reduction in sGaw (compared to baseline) this subject had absolutely no sensation to any of these changes of his lung volume and/or function.
Number 4
Discussion: This subject was referred for further evaluation (and medical optimization) of his asthma, obstructive sleep apnea (OSA) as well as hypercarbia and room air (uncorrected) hypoxemia. Forced expiratory maneuvers were attempted without success as the subject had difficulty coordinating his efforts and providing acceptable and reproducible maneuvers.
Baseline airway mechanics measurements revealed a high end-expiratory resistance. Please note the subject was unable to increase his panting frequency to the optimal 1.5 Hz, despite repeated attempts to do so. After an acute inhalation of a beta-agonist, the Raw improved as did the sGaw. In addition, he was able to “pant” in the desired range. There was also a vast improvement in the high end-expiratory resistance that was evident during baseline measurements; the open-shutter loops returned to a more “normal” appearance. The improvement in Raw was not due to any significant changes in the panting volume.
This example further exemplifies the necessity to evaluate not only the data derived from airway mechanics measurements, but to also inspect the shape (morphology) of the open (and closed) shutter loops as well. To the informed practitioner, airway mechanics graphics provide as much information as do flow-volume loops. Since this patient was unable to perform traditional pulmonary diagnostic testing in an acceptable fashion, airway mechanics measurements provided meaningful information to this patient’s physician (about the status of his pulmonary function) so that the physician could tailor and maximize treatment regimes.
Conclusion:
These case studies illustrate the utility of incorporating total body plethysmographic airway mechanics to enhance the management of patients being evaluated for pulmonary dysfunction. Airway mechanics measurements are useful tools to evaluate the presence, and to quantify the extent, of airway dysfunction. They can be incorporated as primary or adjunctive methods to more traditional pulmonary diagnostic procedures and provide the practitioner with better means to optimize, maximize and individualize medical treatment strategies. Improved treatment tactics, combined with early diagnosis, will benefit our patients and reduce healthcare costs.
Application of Airway Mechanics in the Laboratory Setting:
The following data highlight the importance of including airway mechanics measurements in the evaluation of subjects with potential pulmonary impairment. These examples are varied and similar instances were commonly encountered, on a regular basis, by the UWHC Pulmonary Diagnostic Services. Note: Unless specified, “Post-Drug” results were obtained after 3 inhalations of Isoproterenol (strong Beta2-agonist, fast onset and short-acting).
Example 1.

Note: This example was included to simply illustrate the effect of an acute beta-agonist (Isoproterenol) response
in a subject without evidence of airway mechanics abnormalities.
Example 2.
Example 3.
Example 4.
Example 5.
Example 6.
Note: The Post Beta2-Agonist data was included to illustrate how this subject returned to baseline after non-specific airway challenge with Methacholine.
Such a response should not be used to solely assess “bronchodilator” responsiveness.
Example 7.
Technical Considerations:
When assessing open-shutter loops (during airway resistance measurements) make certain that the tangent is measured according to the reference author technique. Most automated systems allow a user option to override computer generated “line of best-fit”.
See the “Open-Shutter” graphic example below which, depending upon how the open-shutter tangent is determined, illustrates the differences in derived Raw .
Unless there is a reason to include these into the open-shutter loop tangent measurement, they may significantly alter the computer generated “line of best-fit” results .
SUMMARY:
The data derived from Airway Mechanics measurements provide a more complete picture about the integrity of a clients airway caliber, which may not be evident with spirometry alone. Airway mechanics may be used as a stand alone procedure (say, if the subject is unable to perform spirometry) or in concert with other pulmonary diagnostic procedures. To the well trained provider, the shape of the open-shutter loop provides as much information as does a flow-volume loop graphic.
With the continued health care focus on quality, incorporating airway mechanics measures into standard practice should enhance the provider’s understanding of the patient’s pulmonary dysfunction. This additional information should then maximize the HCP’s ability to tailor specific therapeutic intervention(s) for their given patient; thus saving the patient and system time ,money and improve the overall patient experience .
For additional information on this topic, see the video “The Clinical Application of Total Body Plethysmography Airway Mechanics Measurements“ at https://youtu.be/IRXljt4JDPU
Return to Resources at: https://pftlabresources.com/resources/
Some Recommended Readings: No specific reading order
- Wanger J. American Thoracic Society; Pulmonary Function Laboratory Management and Procedure Manual 3rd Edition. Please see: https://www.thoracic.org/professionals/pulmonary-function-testing/
- Hogg JC, et al. Site and nature of airway obstruction in chronic obstructive lung disease. N Engl J Med. 1968:278(25):1355-1360.
- Coates AL, et al. ERS technical standard on bronchial challenge testing: general considerations and performance of methacholine challenge tests. Eur Respir J 2017; 49: 1601526.
- DuBois AB, Botelho SY, Comroe JH. A new method for measuring airway resistance in man using a body plethysmograph. J Clin Invest 1956;35:327-335.
- Smith HR, Irvin CG, Cherniack RM. The utility of spirometry in the diagnosis of reversible airways obstruction. Chest 1992;101:1577-81.
- Ward JC, Beauchamp RK. Specific airway conductance: a sensitive predictor of dynamic compliance. Am Rev Resp Dis ABSTRACT 1980;121:416.
- Snow M, Gharghoury AM, Fallat RJ. Use of airway resistance and specific resistance to define reversible airway obstruction. Chest ABSTRACT 1995.
- Snow M, Anderson B, Kandal K, Fallat R. Airway resistance and lung volumes are valuable adjuncts to spirometry for assessing reversibility of airway obstruction. Respir Care ABSTRACT 1995;11;1179.
- DuBois AB, Botelho SY, Bedell GN, Marshal R, Comroe. JH. A rapid plethysmographic method for measuring thoracic gas volume: a comparison with nitrogen washout method for measuring functional residual capacity in normal subjects. J Clin Invest 1956;35:322.
- Pearle JL. Correlation of helium and plethysmographic lung volumes in airways obstruction. Am Rev Diag 1983;2:47.
- Reinoso MA, Jett JR, Beck KC. Body plethysmography in the evaluation of intrathoracic airway abnormalities. Chest 1992;101(6):1674-1676.
- Bohadana AB, Peslin R, Hannhart B, Teculescu D. Influence of panting frequency on plethysmographic measurements of thoracic gas volume. J Appl Physiol 1982;52(3):739-747.
- Barter CE, Campbell AH. Comparison of airways resistance measurements during panting and quiet breathing. Respiration 1973;30(1):1-11.
- Sauder LR. Computer analysis versus technician analysis of body plethysmographic analog recordings of airway resistance and thoracic gas volume. Respir Care
1982;27(1):62-69. - Blonshine S, Goldman MD. Optimizing performance of respiratory airflow resistance measurements. Chest 2008 Dec;134(6):1304-1309.
- Kaminsky DA. What does airway resistance tell us about lung function? Resp Care Jan 2012;57:1.85-99.
- Parker J, Tzeng A, Wayne S, Haynes JM, Irvin CG, Kaminsky DA. Validation of the clinical utility of sGaw as a response variable in methacholine testing. Respirology 2022. https://doi.org/10.1111/resp.14431 .
- Brown RA. Airway Resistance Measurement. Advance for Respiratory Care Managers 1996; Part 1 Nov pp 37-40; Part 2 Dec pp 65-72.